
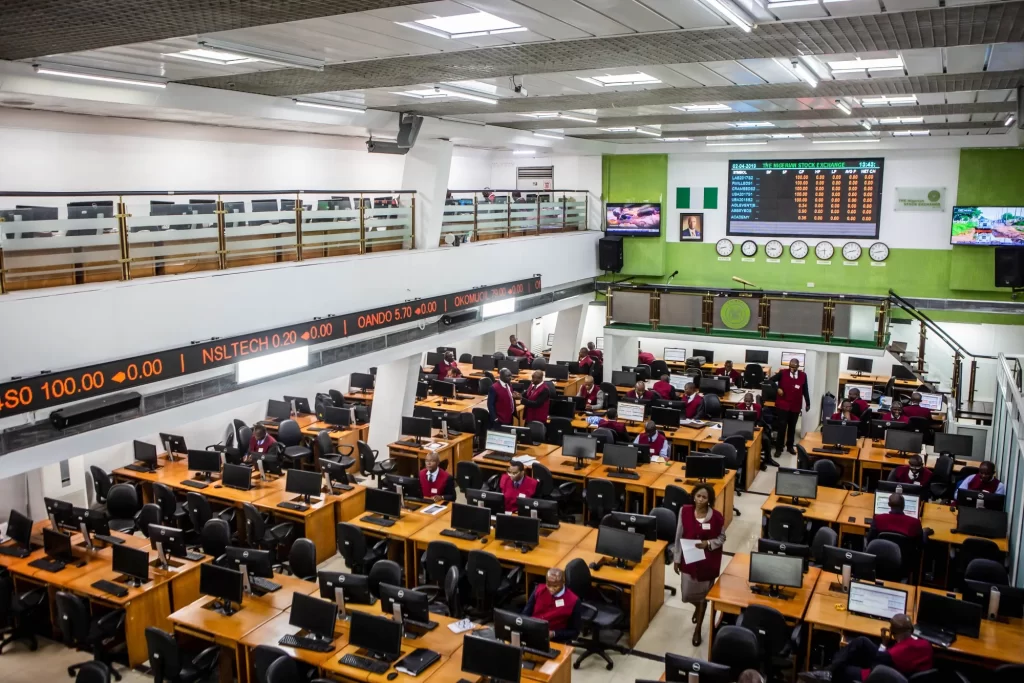
Exchange Traded Funds (ETFs) listed on the Nigerian Exchange (NGX) recorded a broad performance recovery in July 2026, rebounding from the market corrections observed in late H1 2026. The Greenwich Alpha ETF spearheaded the monthly gains with a 30.41% surge, leading a rally in which nine out of twelve tracked funds closed in positive territory.
According to trading data compiled by Nairametrics Research, total market turnover across all twelve NGX-listed ETFs reached 12.74 million units valued at N2.39 billion during July. Overall market breadth across the sector closed overwhelmingly positive, with nine gainers, one fund closing flat, and two declining.
Top Gainers and Sector Performers
Broad-based price appreciation was driven primarily by equity-focused and banking ETFs:
- Greenwich Alpha ETF: Ranked as the month's top performer, gaining 30.41% to close at N917.98 (up from N703.92 in June), as its market capitalization expanded to N5.27 billion.
- Vetiva Banking ETF: Rose 28.29% to end at N31.06 (from N24.21), lifting its market capitalization to N1.98 billion.
- Vetiva Industrial ETF: Advanced 24.68% to settle at N135.90 (from N109.00), expanding its capitalization to N226.39 million.
- Meristem Growth ETF: Appreciated by 19.28% to close at N149.99 (from N125.75), pushing market value to N2.01 billion as it continued recovering from H1 losses.
- SIAML Pension ETF 40: Gained 18.98% to close at N3,103.00 (from N2,608.10). Its market capitalization crossed the milestone N20 billion threshold to reach N20.01 billion, solidifying its status as the second-largest NGX-listed ETF.
- NewGold Exchange Traded Fund: Climbed 15.31% to finish at N110,000.00 (from N95,399.00), bringing market capitalization to N5.87 billion.
- Lotus Halal Equity ETF: Increased by 6.50% to N130.00 (from N122.06), with capitalization growing to N4.34 billion.
- Vetiva Consumer Goods ETF: Added 4.07% to reach N58.00 (from N55.73), with market cap rising to N214.89 million.
- Meristem Value ETF: Edged up 1.41% to N140.00 (from N138.05), increasing capitalization to N1.87 billion and furthering the recovery of the Meristem fund family.
Flat and Losing Funds
While the broader segment rebounded, fixed-income stability and selective profit-taking influenced the remaining funds:
- Vetiva S&P Nigeria Sovereign Bond ETF (Flat): Closed virtually unchanged at N249.00 (from N248.99), maintaining a steady market capitalization of N876.57 million.
- Vetiva Griffin 30 ETF (-0.56%): Slipped marginally to close at N106.00 (from N106.60), reducing market capitalization to N15.31 billion. Despite the slight drop, it retains its position as the largest ETF on the exchange by market capitalization.
- Stanbic IBTC ETF 30 (-9.62%): Recorded the steepest decline of the month, falling to N2,800.00 (from N3,098.00), which reduced its market capitalization to N9.58 billion.
Trading Value and Volume Breakdown
Trading activity highlighted significant variation between high-priced units and low-priced volume drivers:
| Fund Name | Units Traded | Value Traded (Naira) | Key Takeaway |
|---|---|---|---|
| Stanbic IBTC ETF 30 | 328,569 | N823.92 Million | Highest transaction value across all ETFs despite lower unit volume. |
| SIAML Pension ETF 40 | -- | N335.33 Million | Second highest transaction value; crossed N20 billion market cap threshold. |
| Vetiva Griffin 30 ETF | 2.91 Million | N321.23 Million | Second highest trading volume; largest overall ETF by market capitalization. |
| NewGold ETF | 3,139 | N291.37 Million | Lowest unit volume due to high unit price (N110,000.00), but significant total value. |
| Vetiva Banking ETF | 5.73 Million | -- | Most traded ETF by unit volume (5.73 million units). |
| Vetiva Consumer Goods ETF | 1.33 Million | -- | Third highest unit trading volume. |
Market Dynamics and Historical Context
July’s performance represents a notable shift from H1 2026 performance trends. During the first half of the year (January 2 to June 30, 2026), the Stanbic IBTC ETF 30 led all funds with a 219.64% return before experiencing its July pullback. Conversely, the Meristem Growth (-70.41%) and Meristem Value (-63.65%) funds suffered heavy losses in H1 before staging partial recoveries in July.
Investors should note that secondary market price action on NGX-listed ETFs can occasionally diverge from their underlying Net Asset Value (NAV). Due to relatively thin liquidity across the local ETF market, unit prices are strongly influenced by order-flow dynamics, meaning sharp price swings may reflect trading volume imbalances rather than immediate shifts in underlying asset fundamentals.
link text